Example of calculation of harmonics
Contents
New pulse in time domain
n = 2^12; dt = 0.2; s = 10; t0 = 10; f0 = 0.4;

% pulse parameters
% time array
t = (-n/2:n/2-1).' * dt;
% electric field
Et = exp(-(t-t0).^2/s^2 -2i*pi*t*f0);
% LaserPulse object
p1 = LaserPulse(t, 'fs', Et);
p1.frequencyUnits = 'THz';
p1.normalize()
Calculate harmonics
The power operator works, by default, on the time dimension. This allows calculating harmonics using a short notation:
pshg = p1.^2;
pthg = p1.^3;
pfhg = p1.^4;
% Normalized the pulses to make it easier to plot them on the same scale.
normalize(pshg); normalize(pthg); normalize(pfhg);
Plot harmonics
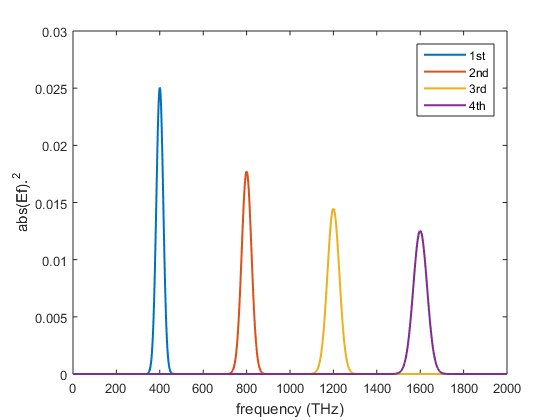
The following figure displays the spectral intensity of the harmonics, in function of frequency.
figure();
plot(p1.frequencyArray,p1.spectralIntensity, ...
  pshg.frequencyArray,pshg.spectralIntensity, ...
  pthg.frequencyArray,pthg.spectralIntensity, ...
  pfhg.frequencyArray,pfhg.spectralIntensity, ...
  'LineWidth', 1.5);
xlabel(['frequency (', p1.frequencyUnits, ')']);
ylabel('abs(Ef).^2');
axis([0 2000 0 0.03])
legend('1st','2nd','3rd', '4th');
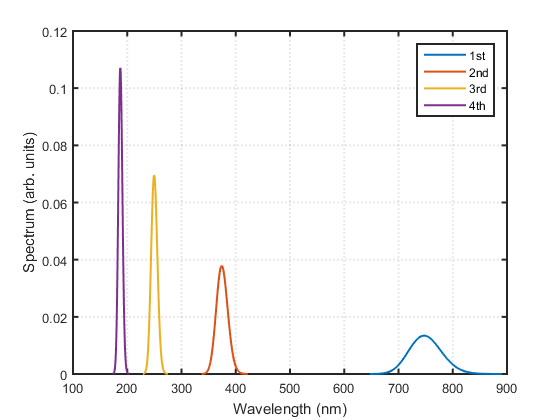
The following figure displays the spectra, in function of wavelength.
p1.plotSpectrum; hold on
pshg.plotSpectrum(gcf);
pthg.plotSpectrum(gcf);
pfhg.plotSpectrum(gcf); hold off
legend('1st','2nd','3rd', '4th');